Mastering Top
top is most likely one of the most known Linux command and also one of the most used one, however most people do not take full advantage of its capabilities.
In this tutorial, we will see a few usages of top that will make allow you to get more out of it.
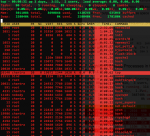
By default, top shows up a pure monochrome display where processes are ordered by CPU usage. While this already give us a lot of information, there is room for improvement!
Adding some color
There is a few things where coloring can be handy in top.
- it will highlight the running processes
- it separates legend from metrics
- it can highlight the column used for sorting
That being said, let’s do it!
You can also press b to use reversed colors to do the highlighting.
To highlight the running task press y.
To highlight the column used for sorting press x.
This is just a subset of what can be done with coloring…. you can find out more by typing Z.
Managing Fields
There is much more fields that can be displayed by top, for instance you might want to be able to see the PPID of a process, the number of page fault…
Selecting Fields
To manage the displayed fields, press f, this will bring up the list below. Mind that when an asterisk is preceding an entry, this means that the entry is enabled.
To enable/disable a field, press the letter shown just before the field name. So, if we want to show the PPID of a process, we would hit b.
* A: PID        = Process Id
* E: USER       = User Name
* H: PR         = Priority
* I: NI         = Nice value
* O: VIRT       = Virtual Image (kb)
* Q: RES        = Resident size (kb)
* T: SHR        = Shared Mem size (kb)
* W: S          = Process Status
* K: %CPU       = CPU usage
* N: %MEM       = Memory usage (RES)
* M: TIME+      = CPU Time, hundredths
  b: PPID       = Parent Process Pid
  c: RUSER      = Real user name
  d: UID        = User Id
  f: GROUP      = Group Name
  g: TTY        = Controlling Tty
  j: P          = Last used cpu (SMP)
  p: SWAP       = Swapped size (kb)
  l: TIME       = CPU Time
  r: CODE       = Code size (kb)
  s: DATA       = Data+Stack size (kb)
  u: nFLT       = Page Fault count
  v: nDRT       = Dirty Pages count
  y: WCHAN      = Sleeping in Function
  z: Flags      = Task Flags <sched.h>
* X: COMMAND    = Command name/line
At this stage, you should now see the PPID field displayed by top.
Good, but wouldn’t it be better to be able to get it displayed right next to the PID?
Ordering Fields
To order fields, we need to get in the field ordering page by typing o. Once there, ordering items is done by using the letter that matches and entry. Typing the letter in lower case shift the item down (e.g right in top display). Upper case moves the item up (e.g left in top display).
Hence, to move our PPID field next to PID, we will hit B as many time as needed until it gets right below PID.
Once done, hit enter to get back top’s main display.
Sort field
The simplest way to choose the sort field is to use < or >.
The former will move the sort field to the left while the latter, will move it to the right.
An alternate way is to enter F or O then select the field by using its letter.
Displaying Full Command Line
By default top only show the short command name. To get the full command name you will need to type c.
This can be really useful when many of your processes are just shown as python for instance. By switching to full command line, you will get to know which python program is actually being ran by the interpreter.
Showing threads
top displays a summation of all thread in a process. To see all threads individually, you can hit H.
Showing All CPU cores
By hitting 1 top will toggle the display of all cpu core on and off.
This way, you can see the CPU usage per core.
Another field can become handy when displaying all CPUs: j . j qill show the last used CPU of a process.
Saving your settings
Last but not least…. once you have tweaked top with all the settings you like, type W to save them, this way, next time you start top it will be already set up!
